Saturday 27 August 2016

TNLOGIS - My Views From Technical Analysis So Far


TNLOGIS is keep falling in 7 trading day continuously, perhaps this is a short term arbitrage due to the risk of FED interest rate decision.

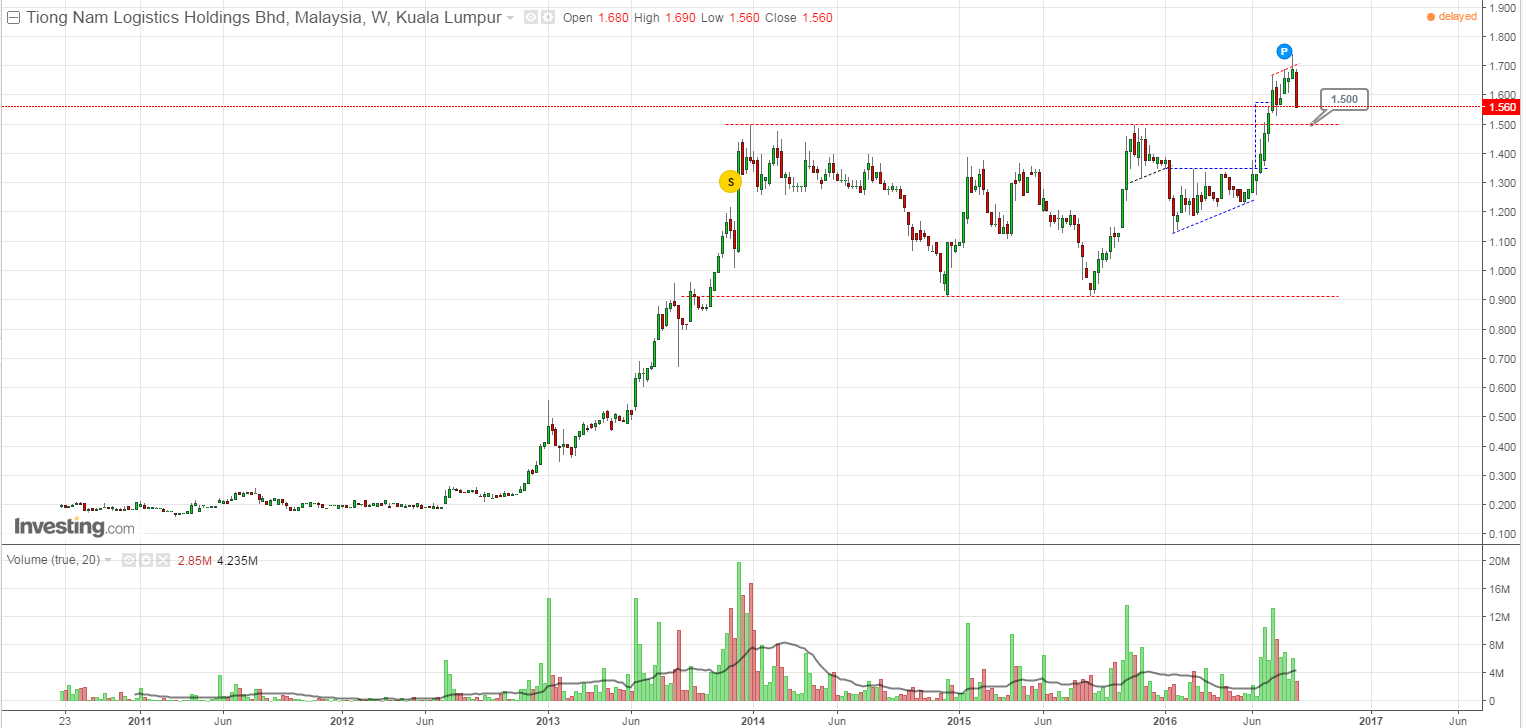
According from daily chart, the symmetrical triangle sideways is started in early of 2016, and breakthrough around June, after that it moving above the neckline nearly 2 month before fall below. If the former is base and current is head, head is smaller than base, so I will think this is a correction instead of downtrend. Now, the current target price is 1.527, and the major support is 1.5.

Operation wise, I will start to accumulate around at 1.527, stop lose at 1.5 which is 2% of risk. So, risk management is the top priority now. 


TNLOGIS 连续跌足7 个交易日,估计这也许是应了FED 带出的利率风险而套了短期利润。

从日线来看,收敛三角式的横盘整理就在2016 年初开始,大约走了6个月左右往上突破,相对颈线之上的走势大概盘了将近两个月才跌破。如果前者是盘底,后者是盘头,而头部比底部小得多,那么以目前的形态上来看,我个人认为这只是修正,而不是长空趋势。如今的波段跌幅目标大概是 1.527,而多头支撑是1.5。

操作上,我会在1.527 左右开始进场,停损就在1.5 也就是2% 的风险,毕竟风险管理才是第一。


Thursday 25 August 2016

AAX Hit To The Turbulence


AAX was impacted by strong turbulence.
Market sentiment is affected by Jackson Hole conference this Friday and causing short-term arbitrage in among of the stocks.
Today AAX fall below its second wave starting point 0.41, and I will set 0.375 is the next support. Currently, a war is between the long - short player, as long as support is not broken, AAX will having a sideways in the between 0.375 to 0.41 for about one and the half month, then the direction will be determine, otherwise, there is a risk to crash.


AAX 遭到了强劲气流的冲击。
市场的气氛受到这个礼拜五的Jackson Hole 会议,突然出现短期套利。
今天的AAX也跌破了它第二波的起涨点 0.41,而我会将下一个支撑设在0.375。目前多空主力互相交战,由多转盘,只要支撑不破,AAX 会在0.375 到 0.41 之间展开大概一个月半的横盘发展,然后才对多空作出表态,否则,就会有坠机的危险了。


Disclaimer

Please bare in mind that the stock market is full of risk, any forecasts and analysis has no guarantee can be made. 

Monday 22 August 2016

Will POWER ROOT Power Again?


Observe from the daily chart, POWER ROOT started a 4 days decline since 11/8 continuously, these was enough to bring small player panic selling, and also trap some of the small investor who bought at above 2.28. Currently, support is 1.955, as long as the support is not broken, I think this stock will progress between line A & B. Perhaps, it might be a chance to escape from trap, but, will it POWER again? I personally would think it still need to keep monitoring closely. 


从日线观察,POWER ROOT 从11/8 开始连4 天的跌幅,已经足以让小户出现恐慌性卖出,同时也将一些买在高点的资金套在2.28 之上。目前支撑来到1.955,只要能维持在支撑线上,我认为这档股票会大幅度的在A & B 之间来做震荡。也许,套在2.28 之上的资金会有解套的机会,但是,至于还能否再POWER?我个人认为还是需要持续观察。


Sunday 21 August 2016

1700! What Next?


1700! But appear just in a day. So far, KLSE will going to sideways for a short period, but whether it able to challenge another high point again, 1680 is the important short term support. 

1700! 但是却昙花一现。目前大盘 KLSE 将会横盘整理一小段,但是否还能再次往上挑战,1680 是一个很重要的短线支撑。


Wednesday 17 August 2016

AAX - Would You Miss The Second Flight Again?


I had been started to tracking the AAX since a month ago, and waiting for breakthrough patiently, but surprisingly it breakthrough aggressively. From weekly chart, we can see there is couple of pull up volume from big player, then proceed with the flag shape adjustment, finally make a breakthrough. So, this kind of trending structure, I can boldly predict that higher got another higher, which is the target price is about 0.61. Besides, if observe from daily chart, the resistance become support, thus the support is become 0.405, and the retracement support is 0.415. Anyway, I will closely monitoring.

Apart from this, AAX is the only left for aviation industry except the flying Air Asia in the KLSE. Therefore, base on these factor, I choice to on-board.


大概 一个月前就开始追踪了AAX,耐心的等待突破压力,但是却想像不到会以这样的方式做突破。从周线,可以看得见主力的推升量,然后配合旗形调整,再作出突破。以这样的走势结构,我大胆预测高点可以有更高点,那就是目前测出的波段涨幅大约 0.61。另外,从日线观察,压力变支撑,目前的多头支撑在 0.405,回测支撑在0.415。无论如何,我都会持续追踪。

另外,在整个KLSE 里,除了已经飞上天空的Air Asia,就只剩下AAX 而已。所以,基于这几个因素我选择了登机。


Disclaimer

Please bare in mind that the stock market is full of risk, any forecasts and analysis has no guarantee can be made. 


Tuesday 16 August 2016

TNLOGIS Bull Run Is Started


TNLOGIS breakthrough the resistance in this recent day, resistance become support, and so far the support is going up to 1.68.

This can be more obvious to observe from the weekly chart that a sideways is consolidated about two and the half year within the substantial interval, and finally breakout in the earlier of June 2016. Now, the direction is pointing to uptrend no matter from daily, weekly or monthly chart, and I predict the target price should able to reach about 2.2, so in the operation wise, I will try to accumulate when retracement as long as support is set properly. Well, is bull run started? Yes I think so.  

TNLOGIS 在近这几天的交易日里突破了压力,压力变支撑,短线支撑提升到1.68。

从周线可以更明显的看得见,一个横盘整理了大约两年半的大区间,终于在六月初就开始被突破了。无论是从日线,周线,还是月线都直指去一个大多头的方向,以目前的波段计算大概会到 2.2,而在操作上,只要看好支撑我会尝试在回测时做买进的动作。所以,这个算是多头吗?我认为这个就是。


Sunday 14 August 2016

PADINI, Here Comes a Bear


近期PADINI 开始转弱,短线支撑来到2.86,一旦跌破,狼这次就应该真的来了,而这波的多头行情就是时候宣布结束。

PADINI turn weak recently, and I will set 2.86 as the current support, once broken then consider the bull run is going to the end soon. 


目前PADINI 的走势基本上符合了我在 PADINI TA - Now and Future 的预期,不管从日线,周线还是月线都已经到达了波段涨幅区间大约2.80,虽然价位屡创新高,量却是收缩,所以必须额外小心,而我大胆估计上升趋势已经差不多走到了尽头,而即将进入一个大幅度震荡的区间,也许是筑一个头部区,或大区间的调整也说不定。无论如何,如果在波段涨幅满足后仍继续追价,这只会将自身的风险大幅提升。

在操作上,中短期策略我都会选择在到达了涨幅满足后就获利了解,毕竟没有人可以真正卖在最高的价位,除非你是造市者。


So far, PADINI trend is still meet my expectation in PADINI TA - Now and Futureregardless from daily, weekly or monthly chart, the target price about 2.8 is reached, although it keep break the record high, but the volume is decreasing, so extra cautions is needed, and now I dare to predict that the uptrend is almost come to the end, next is about to enter a substantial shock interval, perhaps building a head or a big adjustment. No matter how, this is not advisable to buy in after the target price is reached, because this will going to increase the risk itself.

In mid & short term operation, I will choose to arbitrage right after reaching the target price, because no one can really sell at the highest price, unless you are the market maker.


Saturday 13 August 2016

KAWAN Is On Fire


朋友告急!
KAWAN 站上了3.26,就开始大幅度震荡了大概两个月,但是却多番都越不过前头部的右肩。尤其是在最近期的挑战失败后直接跌破短线支撑 3.65(支撑 1),在时间框作出弱势表态。如果下一个交易日站不上支撑 (支撑 1),那么就直接看3.57 (支撑 2)。在我的看法,如果连支撑 1 都站不上,就已经表示了短期走空,主力做了短期套利。

目前KAWAN 的走势这也符合了我在 My Views On The Future Trend of KAWAN 的预期,毕竟这两个月的大震荡,并不是一般人可以承受的。虽然看似短期走空,但还不能断定是长空趋势,必须持续观察,因为KAWAN 第二季的财报即将在这个8 月尾出炉。所以,可以肯定的是我不会选择在这个时间进场。


KAWAN is on fire!
Since KAWAN stood above 3.26,  then it started substantial oscillating for about 2 month, but still unable to surpass the head of the right shoulder. Especially after the failure from the most recent challenge directly fall below the support 3.65 (支撑 1), and made vulnerable position right after the symmetric time frame. If still unable to stand above the support 1 on the next trading day, else next support will go to (支撑 2). In my view, this is not optimistic if the support 1 is fail to sustain.


Currently, KAWAN trend is still meet my view in My Views On The Future Trend of KAWAN. Although short term seem bearish, but still need continue to observe before conclude it is a long term bear run as of the KAWAN second quarter financial report is upcoming soon by end of August. Therefore, now is not the suitable time for me to play yet.


Related
KAWAN Mean Friendship Forever?
My Views On The Future Trend of KAWAN


Friday 12 August 2016

TA ANN Bull Run Is Starting Up?!


Actually, I am not the fans of Palm Oil stock, because the Malaysia Palm Oil Index (FBMPALMOIL) trend is not optimistic, but I notice that TA ANN righting strong signal (翻强讯号) at about end of July, and then made a show a positive side in the symmetric time frame (时间框对称), then breakthrough the resistance. Although short term target is reached currently, the support came to 3.52, but I think TA ANN bulls will not just ended like that, conversely, as long as the support is not broken, I will be bold estimate this is the TA ANN bullish trend. 

其实之前我都蛮不看好油棕股,因为当时FBMPALMOIL 大马油棕指数的走势并不乐观,但是却在大约7 月尾时注意到TA ANN 出现翻强讯号,然后也在对等的时间框作出了强势的表态,之后就突破阻力上涨。虽然目前的短期满足已经到达,支撑来到3.52,但是我却认为TA ANN 的多头不会就这样结束,相反,只要能维持在支撑,这次我大胆点预估这个将会是TA ANN 的主升段。


Monday 8 August 2016

1700


After the BREXIT, KLSE still able to stabilized, then the trend brewing for some time, and now waiting for the final breakthrough. Once breakthrough, I believe 1700 is not a mission impossible. "God wants you to destroy, they first make you crazy", if the crash is unavoidable, then I am waiting for the final uptrend!

经过了BREXIT 的洗礼,还能回稳;然后酝酿了一段时间的走势,最后等待的是突破阻力。一旦突破,我相信1700 应该是可以期待。“上帝要你灭亡,必先让你疯狂”, 如果这一场崩盘是无可避免,那么就痛痛快快涨多一波吧!


Monday 1 August 2016

SAM Engineering TA - Buy High Or Buy Low?


Recently a friend asked about my opinion on SAM Engineering, so here is my TA analysis for this popular stock since I am free tonight.

According from daily chart, the former high (point B) could not break the record high (point A), and the price is fell down continuously, so short-term support now is about 7.295. Currently, it is high possibility heading to the neckline if the short term support is fail to defend, and then a bigger head pattern will form if observe from weekly chart, and 6.00 is the support for the neckline, once broken consider bearish is confirm.

In short, I am not that optimistic regardless from daily or weekly chart, as we always buy low, not buy high, so I do think the best choice so far is keep monitoring closely, because I would rather miss and not to make a mistake.


近期有位朋友问我对SAM Engineering 的看法,难得今晚空闲就对这档热门股做了分析。

从日线来看,前高(B点)突破不了历史高点 (A 点),然后又连接往下杀,短线支撑大概在7.295。目前如果灌破就有很大的可能性来到颈线,就会在周线中形成一个大头部,而这个颈线的支撑大概是6.00,一旦跌破空头就确立。

无论从日线还是周线来看都并不是那么乐观,股票永远是买在底部,而不是买在头部,所以我认为目前最好是应该持续观望,宁愿错过也不愿作错。


Timing...

 Today is the first post without any chart... Just because of I realised the important of timing...