Showing posts with label TNLOGIS. Show all posts

Tuesday, 1 November 2016

TNLOGIS Turn To Strong Position


强势表态!
自结束了时间框后,TNLOGIS 开始在25/10 转强,然后观察了一连四个交易后,就在31/10 带量站上了起跌点,视为强势表态。最后,今天不需要回测支撑,就直接带量来突破前高点,但唯一的小遗憾就是今天最后收了一根上影线,而非以收盘价创下历史新高。

目前支撑已经来到了1.72,诚如我在之前的看法,短期内虽会有下修,但不是一个长空结构,所以我依然维持长期看多,一旦完全突破压力线,预计的大波段涨幅会在大约2.15。


Since the end of the time frame, TNLOGIS began to strengthen in 25/10, and then stood above 1.67 (which is the starting fall down point) after four trading day. Today, TNLOGIS breakthrough previous high with volume directly, but the only disappointment is closing with a shadow rather than with a record high price.

Currently, 1.72 is the support now, just as of my previous post mentioned that this is a correction instead of downtrend, so I will still remain as optimistic. So, once fully break through the resistance, then the estimated target price would be about 2.15.


Saturday, 27 August 2016

TNLOGIS - My Views From Technical Analysis So Far


TNLOGIS is keep falling in 7 trading day continuously, perhaps this is a short term arbitrage due to the risk of FED interest rate decision.

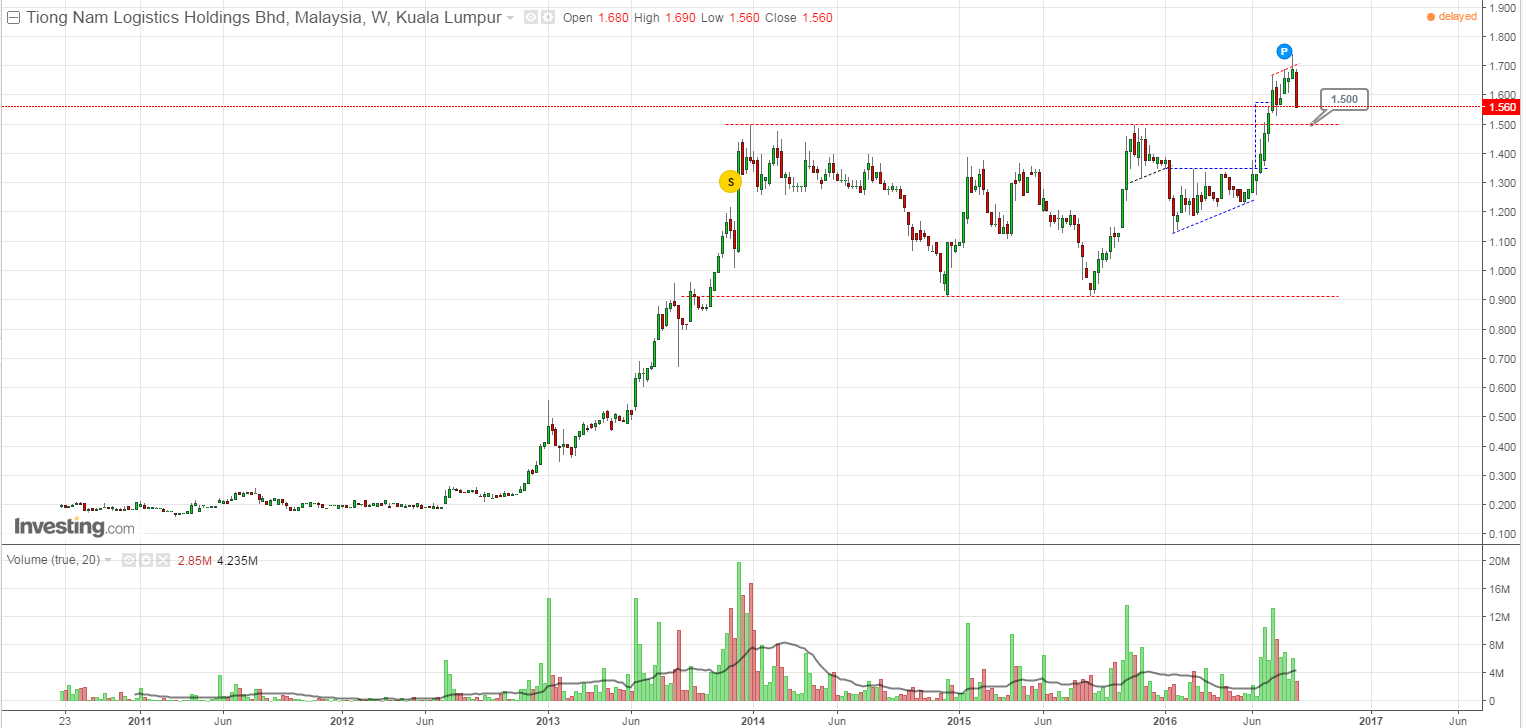
According from daily chart, the symmetrical triangle sideways is started in early of 2016, and breakthrough around June, after that it moving above the neckline nearly 2 month before fall below. If the former is base and current is head, head is smaller than base, so I will think this is a correction instead of downtrend. Now, the current target price is 1.527, and the major support is 1.5.

Operation wise, I will start to accumulate around at 1.527, stop lose at 1.5 which is 2% of risk. So, risk management is the top priority now. 


TNLOGIS 连续跌足7 个交易日,估计这也许是应了FED 带出的利率风险而套了短期利润。

从日线来看,收敛三角式的横盘整理就在2016 年初开始,大约走了6个月左右往上突破,相对颈线之上的走势大概盘了将近两个月才跌破。如果前者是盘底,后者是盘头,而头部比底部小得多,那么以目前的形态上来看,我个人认为这只是修正,而不是长空趋势。如今的波段跌幅目标大概是 1.527,而多头支撑是1.5。

操作上,我会在1.527 左右开始进场,停损就在1.5 也就是2% 的风险,毕竟风险管理才是第一。


Tuesday, 16 August 2016

TNLOGIS Bull Run Is Started


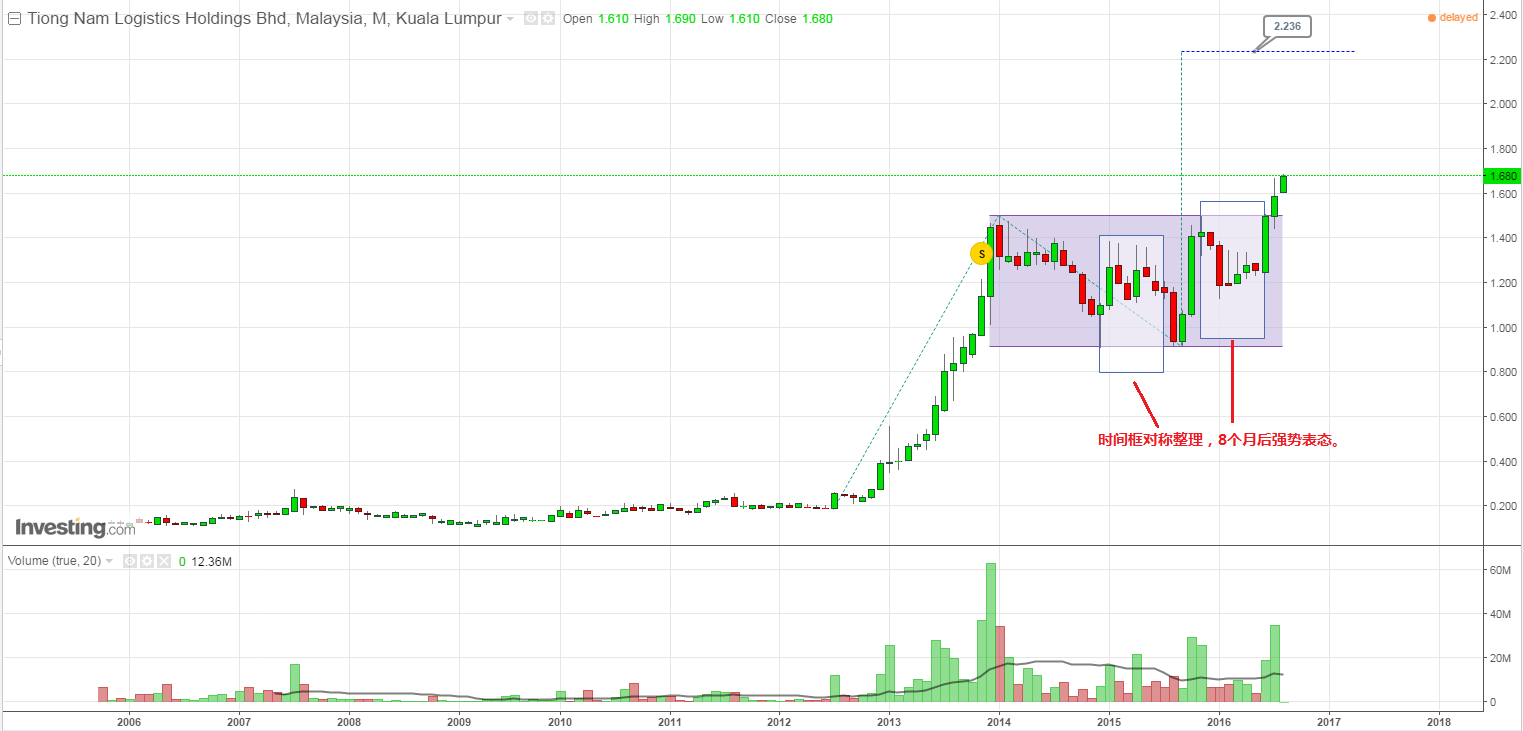
TNLOGIS breakthrough the resistance in this recent day, resistance become support, and so far the support is going up to 1.68.

This can be more obvious to observe from the weekly chart that a sideways is consolidated about two and the half year within the substantial interval, and finally breakout in the earlier of June 2016. Now, the direction is pointing to uptrend no matter from daily, weekly or monthly chart, and I predict the target price should able to reach about 2.2, so in the operation wise, I will try to accumulate when retracement as long as support is set properly. Well, is bull run started? Yes I think so.  

TNLOGIS 在近这几天的交易日里突破了压力,压力变支撑,短线支撑提升到1.68。

从周线可以更明显的看得见,一个横盘整理了大约两年半的大区间,终于在六月初就开始被突破了。无论是从日线,周线,还是月线都直指去一个大多头的方向,以目前的波段计算大概会到 2.2,而在操作上,只要看好支撑我会尝试在回测时做买进的动作。所以,这个算是多头吗?我认为这个就是。


Timing...

 Today is the first post without any chart... Just because of I realised the important of timing...