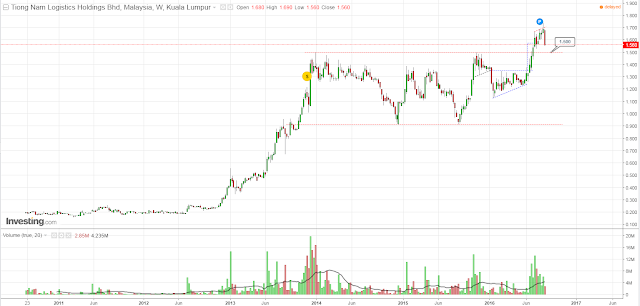
TNLOGIS is keep falling in 7 trading day continuously, perhaps this is a short term arbitrage due to the risk of FED interest rate decision.
According from daily chart, the symmetrical triangle sideways is started in early of 2016, and breakthrough around June, after that it moving above the neckline nearly 2 month before fall below. If the former is base and current is head, head is smaller than base, so I will think this is a correction instead of downtrend. Now, the current target price is 1.527, and the major support is 1.5.
Operation wise, I will start to accumulate around at 1.527, stop lose at 1.5 which is 2% of risk. So, risk management is the top priority now.
TNLOGIS 连续跌足7 个交易日,估计这也许是应了FED 带出的利率风险而套了短期利润。
从日线来看,收敛三角式的横盘整理就在2016 年初开始,大约走了6个月左右往上突破,相对颈线之上的走势大概盘了将近两个月才跌破。如果前者是盘底,后者是盘头,而头部比底部小得多,那么以目前的形态上来看,我个人认为这只是修正,而不是长空趋势。如今的波段跌幅目标大概是 1.527,而多头支撑是1.5。
操作上,我会在1.527 左右开始进场,停损就在1.5 也就是2% 的风险,毕竟风险管理才是第一。


No comments:
Post a Comment