Thursday, 28 July 2016

PANAMY The Next Record High Is Reached


After about 2 month of deliberation, this heavyweight stocks finally start its main section of the bullish trend finally. Now, PANAMY has reached the target price, and I will operate on short-term arbitrage because the big head pattern will start building right after the zone above the target price, and the risk is increase greatly, after all the bullish trend is ended with big head pattern most of the time. Rather miss than done wrong, so I won't suggest to buy in at this moment unless someone who are willing to buy with higher price.   


经过大约两个月的酝酿,这档重量级股票终于如预期中走出一个多头趋势,而这个也是PANAMY 的主升段。如今,PANAMY 已经到达了大波段的涨幅满足,中短期操作上我都会套利,因为在涨幅满足之上都是筑大头部的区间,相对的风险也大副提升,毕竟主升段都是以一个大规模的头部来结束。宁可错过也不可作错,所以我都不会建议在这个时候进场,除非你想在高档区接我的货。

Related 
PANAMY The Next Record High
PANAMY The Next Record High - My Review

Wednesday, 20 July 2016

PADINI TA - Now and Future


PADINI is stand on the neckline without adjustment after fall below the neckline due to BREXIT day, and the short atmosphere eliminated directly by this action. So, the neckline is turn into adjustment interval a & b, this can be seen as an adjustment before bullish. Breakthrough point a, then goes up after retracement, the first support is established at 2.37; Then breakthrough point c as the confirmation of bullish trend, support increase up to 2.49. So, all these are the standard behavior of a strong trend. Therefore, I predict 2.715 is the next short term target price.    

PADINI 破了颈线不须调整就直接站上颈线,将空头氛围给消灭,由空转多,颈线就转变成双轨下调区间 a & b,可以看成多头调整或多空交叉。突破了a,回测又上涨,第一多头支撑建立在2.37;然后突破 c 多头确立,支撑提升到2.49。这些都是强势股的标准行为,而这一波我预计可以看得到大概2.715。


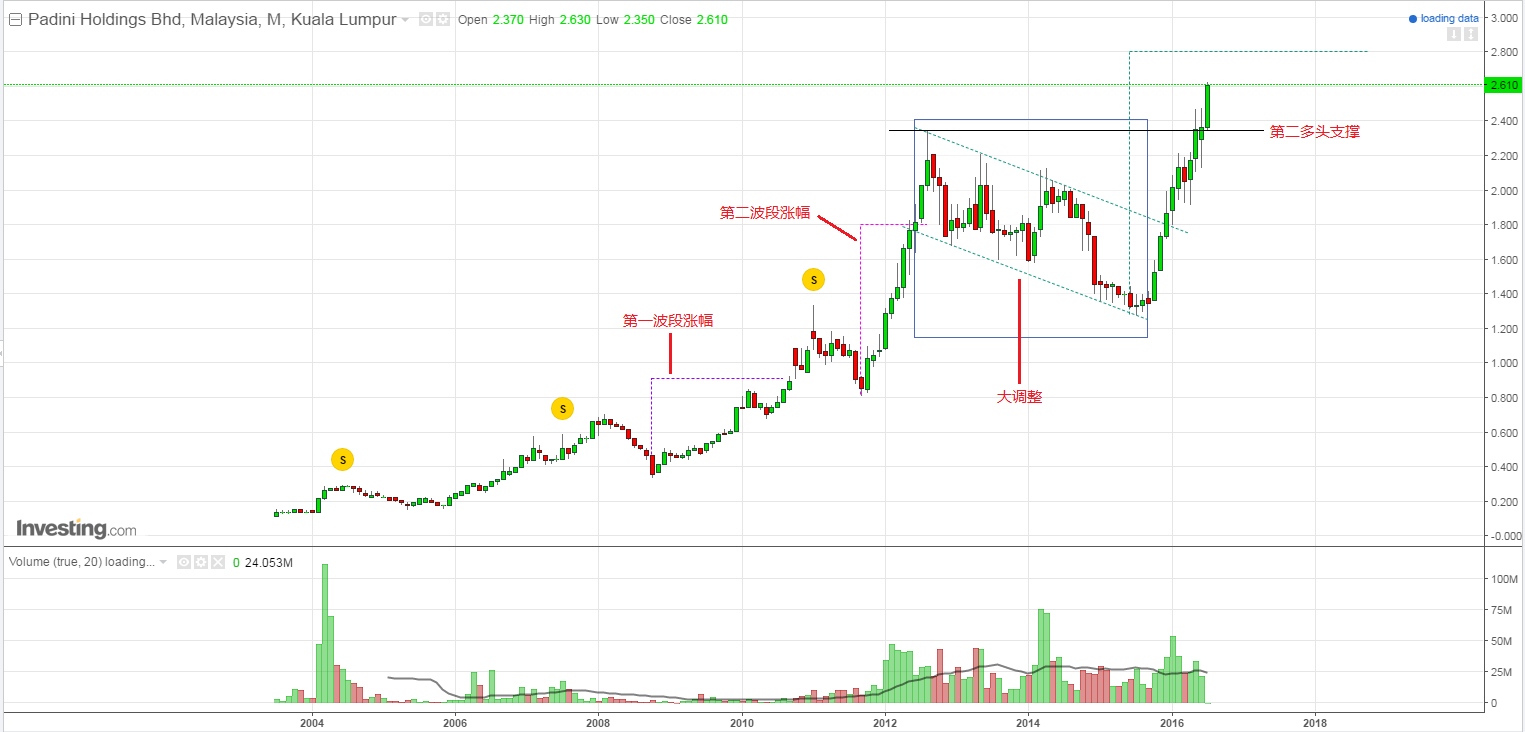
From monthly chart, PADINI is breakthrough the historical high now and the target price is about 2.8 and 2.345 is the support for this strong trend. If I am not mistaken, there will be a sideways or ramp shape adjustment, then again to rise over 2.8 until it begin to build a larger head pattern to put this bullish trend to the end. 

以月线来看现在是已经突破了历史高点,波段计算是可以预计涨到2.8,而如今的多头支撑是2.345。我如果没有看错,日后的走势会有一段横盘或下斜调整,然后又再上涨越过 2.8 直到开始盘头,最后会做一个更大的头部以结束这波的多头趋势


Tuesday, 19 July 2016

Is TUNEPRO Turn!


Is TUNEPRO Turn?
Is TUNEPRO Turn Weak?
TUNEPRO Reviews

Is TUNEPRO Turn!
TUNEPRO sideways for about 2 months, finally breakthrough the resistance and current support is about 1.58. Actually, TUNEPRO is suitable for mid-long term strategy which I always thought before, because the patient from short term strategy will ease away by large range of pricing consolidation. Now, the base is complete, I predict this is the bullish trend and every retracement is the buy opportunity. Again, a long wait breakthrough is came finally, so don't let me down.


期盼了许久的突破终于来了。
TUNEPRO 横盘整理了大约两个月,终于突破了大压力线,支撑建立在大约1.58。TUNEPRO 其实是属于一档中长期策略的股,也就是我之前一直认为的,因为短期策略的耐心会被大区间的横盘价格整理而消磨掉。如今大底部已经完成,我认为会走一个多头格局,凡是回调都是买进的时机。再次想说,期盼了许久的突破终于来了,希望别让我失望。

Thursday, 14 July 2016

UEMS, MINHO, IVORY & PADINI - The Post BREXIT Comment


UEMS 如预期的横盘了大约一个月左右,然后顺道在BNM 宣布调降OPR 后以突破压力线作出了表态。虽然突破了压力线,但是能否突破前面的假讯号才是关键点;而今天微跌到底是做回测还是又多一个假突破讯号?就看这几天的交易日了。


相比之下,MINHO 的走势来得更强,自BREXIT 的大利空后由多转盘,但是横盘整理的时间比UEMS 还短,然后就一路向北,这也就是有在 UEMS & MINHO Is Looks Black Too 里提过的主力始终都欲在一连串的企业活动中推动股价。所以,有主力的果然就是不一样。


基本上 IVORY 如果站不上颈线,我的看法依然维持 Sorry, I Still Don't think So,而且还留了一个非常长的上影线。所以,目前我预计会有一段横盘的发展以抵消空头氛围。


PADINI, 我低估了主力要卫捍多头局势的决心,就算利空破颈线,不做调整直接拉上颈线。既然如此,也必须尊重市场的意愿,如果前高挑战成功,那么下一个挑战就是 2.80 了。


Related Post

Is PADINI Raising or Fallen?
PADINI & IVORY Still Continue The Path To Glorious?
UEMS & MINHO Is Looks Black Too
PADINI & IVORY Still Continue The Path To Glorious? Sorry, I Don't Think So.

Monday, 4 July 2016

Will Crude Oil and Gold Hint The FED Decision?


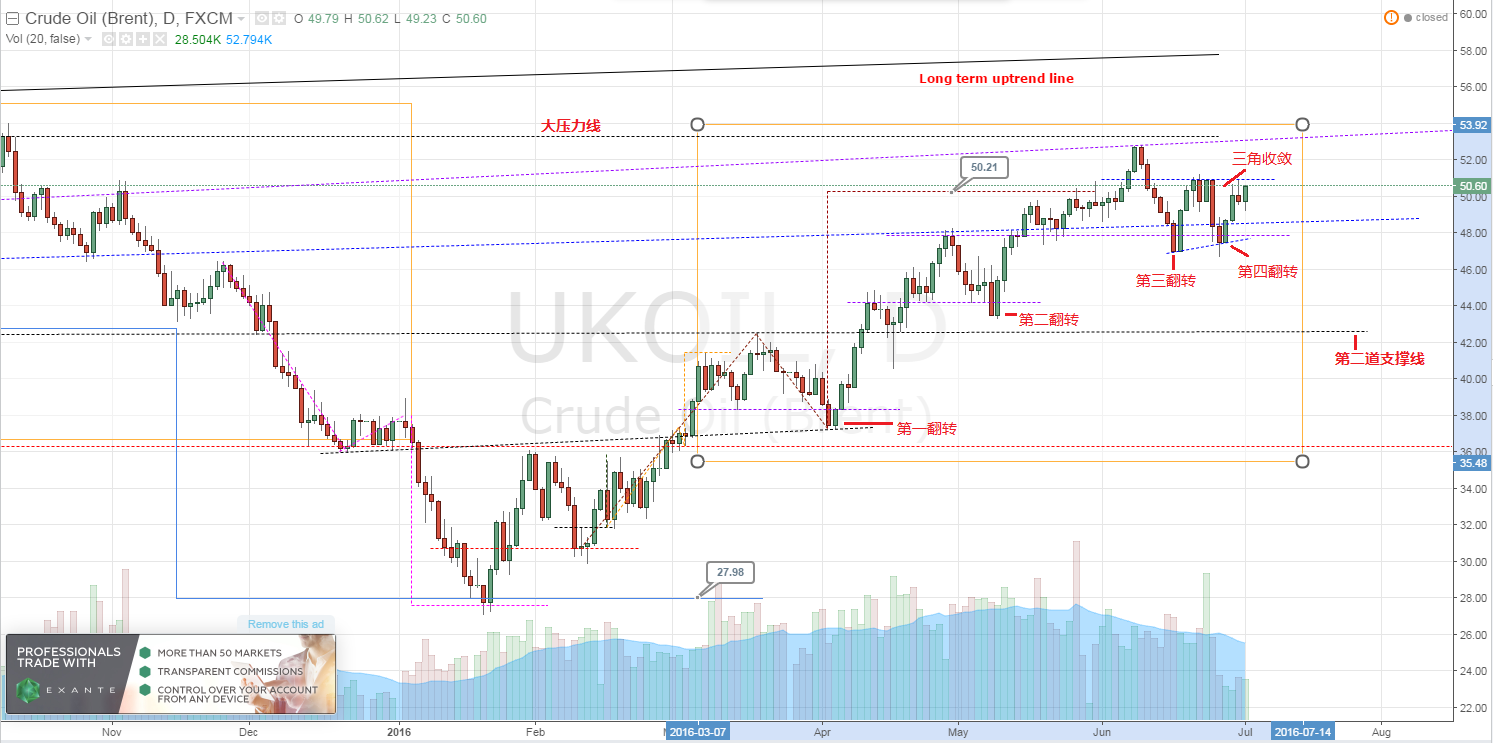
Since about a month ago after Crude Oil - My Analysis, Operation, and Views, Brent Oil is station above 50USD and maintain sideways above the second support line. Same for WTI also reached my target price and then do sideways.

自從在我大概一個月前對油價的看法後 - Crude Oil - My Analysis, Operation, and ViewsBrent Oil 就如預期的站上50USD,而且還在第二支撐線上做橫盤走勢。同樣的,WTI也到達了波段漲幅,然後做橫盤整理。


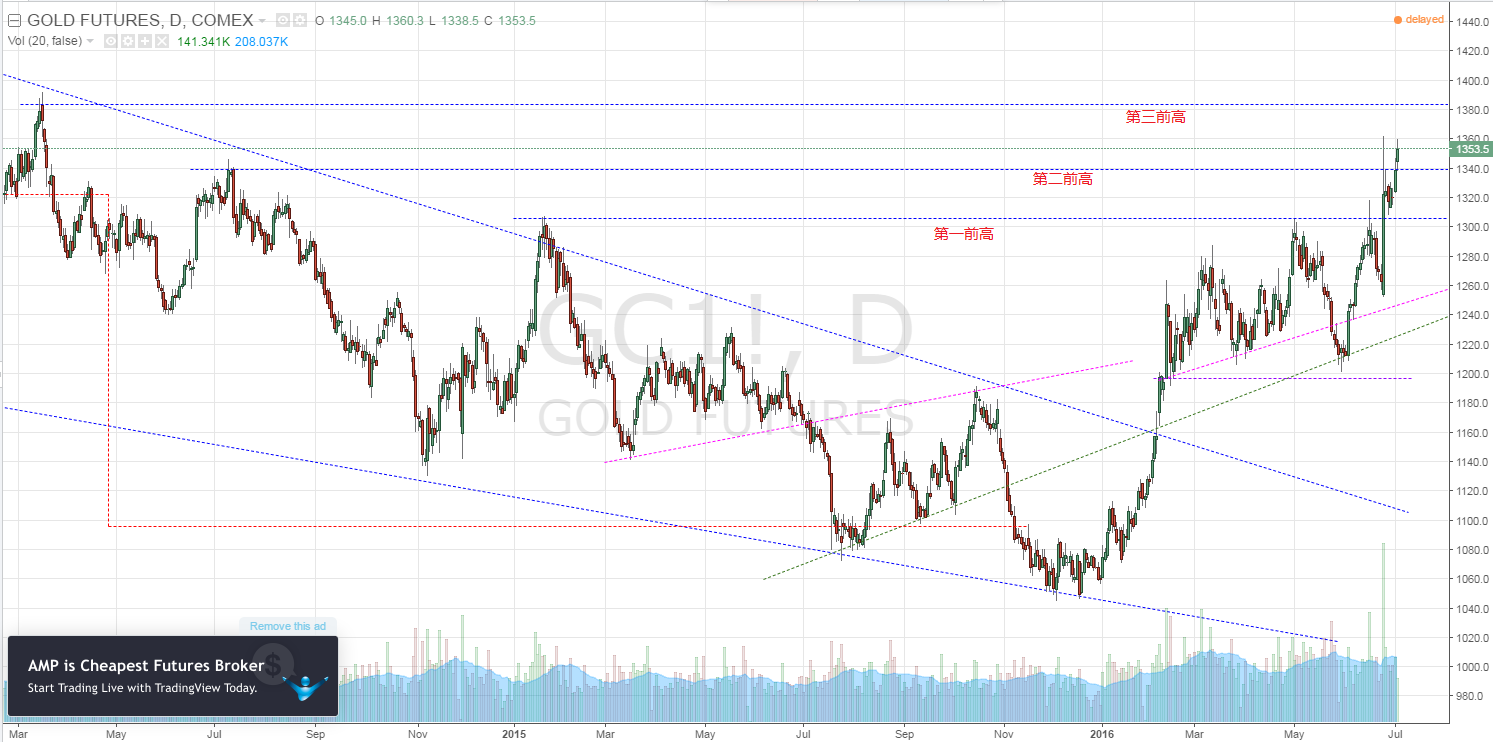
Now, Crude Oil is going to form a triangle pattern, go up or down? I think we will able to know at around mid of July, these also inline with the FED interest rate policy meeting in July as well. All the while, Inflation has been determined interest rate policy, while crude oil affects inflation and lastly all about the demand and supply. But, Operation Twist & QE is implemented since few years ago, plus extreme low/negative interest rate just to push inflation, thus the impact is become interest rate policy affects crude oil price. Moreover, Gold Spot is keep challenge previous high even since BREXIT, which I can see the high risk awareness is getting important. Through Crude Oil & Gold Spot trend, I guess the market is preparing for the next coming FED interest rate policy meeting. So, are you ready?

如今原油的走勢逐漸走向三角收斂,往上漲還是往下跌?我预计原油大概會在7月中旬左右表態,也配合了FED 在7 月的利率政策会议,因为一直以来通货膨胀决定了利率政策,而原油影响了通货膨胀,最后供需关系影响了原油;但是这几年来的逆向操作,大量宽松,为了拉动通货膨胀而不惜实行底/负利率,变成利率政策影响了原油走势。另外,黄金自从Brexit后的走势也不断的挑战前高,避险的意识非常重;原油,黄金的走势,我猜测市场正在为即将到来的FED 利率政策会议而做准备,你呢?


Sunday, 3 July 2016

MAGNI's Beauty Is Fading Away


Nothing will last forever.
MAGNI is fall below the neckline finally after the head is formed about half year more, so far it reach the short term downtrend target price, but I predict the downtrend target price corresponding to the head is about 3.53; maybe a rebound will occur, but this will consider as an escape signal if unable to stand above the neckline. So, whether will having another bearish trend again, then need to keep monitor closely, but at least the current price is not my favor.

花无百日红,“美女”也会有衰老的一天。
盘了大约半年多的头部,也终于破颈线,目前是满足了小头部的跌幅,但是预计这波大头部的跌幅会到大约3.53;也许会有反弹波,但只要越不过颈线都是逃命波的一种。至于以后会不会再有多头行情,那就必须持续观察,至少现在这个价位并不是我心中的安全位置。


Monday, 27 June 2016

BREXIT Is Just a Beginning

BREXIT finally is happened. 
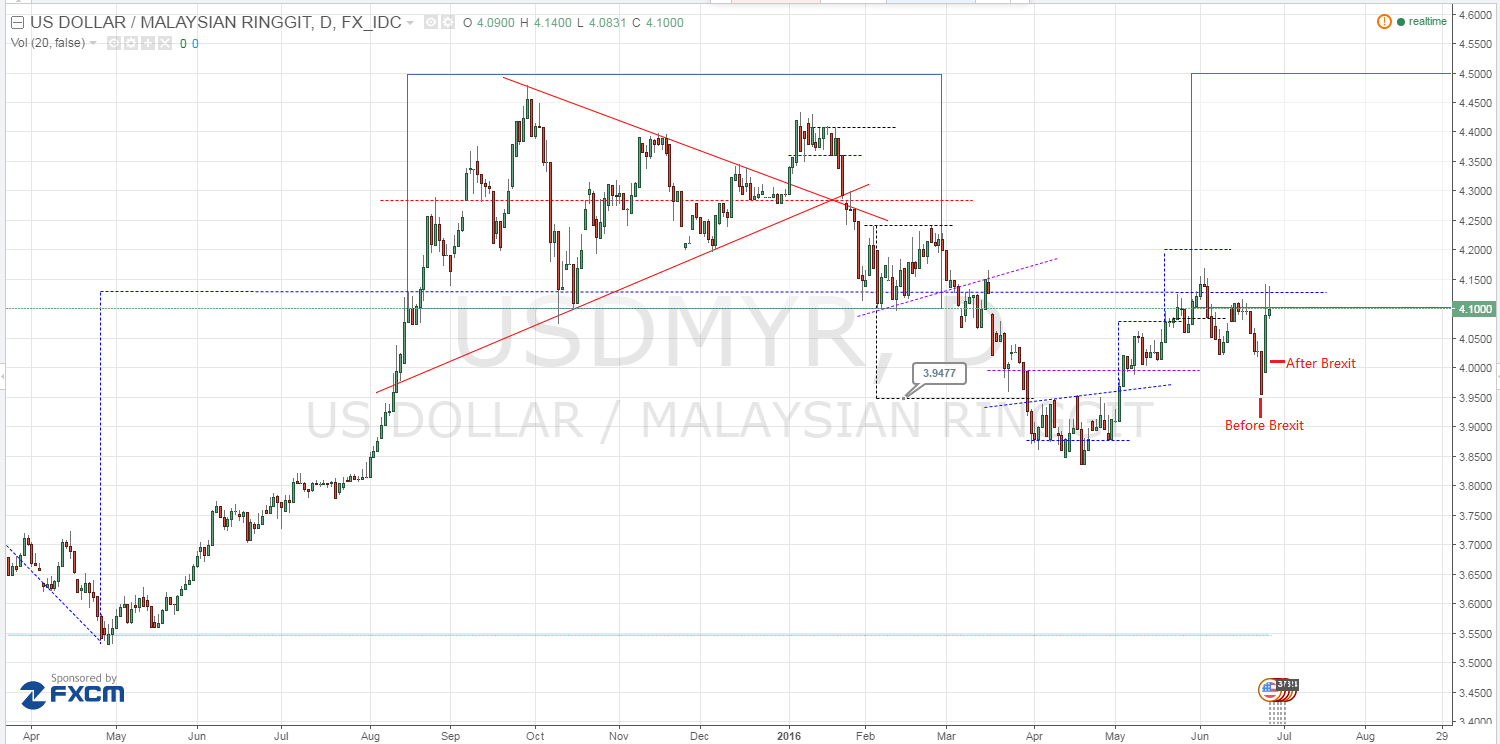
Although most of the Central Bank and Investment Institute had did preparation by observe from the USD/MYR which rose before the day of BREXIT, to prepare enough local currency for the contingency of financial crisis. However, a big shock still happen in financial market on that day, and every investment institute is busy to supporting the stock market thus cause KLCI close with a very long shadows.   

BREXIT 最后真的发生了,虽然很多的央行和投资机构事前都做好了准备,从USD/MYR 可以看得出在BREXIT 前一天还大升了一段,明显的国内一些投资机构和央行大量汇了本币以防万一 。然而,还是引发了在金融市场的大波动,当天各大“国家队”在收市前忙着撑稳股市汇率,也因此KLCI 收了一根非常长的下影线,而且还一度跌破 了支撑。


But, did the story ended like that? No.
Dow Jones Index fall below the small neckline finally and going to downtrend which heading to the biggest neckline. At the same time, S&P 500 is facing the same fate too.

可是,故事是不是这样就结束?我想并没有。
美国的Dow Jones Index 盘了那么巨大的大头部,终于都破了小颈线转为空头趋势往大头部的颈线迈进,同样的S&P 500 也面临一样的走势。


The only developed country stock market - Japan NIKKEI 225, also is the weakest stock market fell about one thousand point on that day, some more it break the downtrend support line as well. So, I predict still have room to drop, which until the first downtrend target point 13495.

而亚洲唯一的先进国股市 - 日本 NIKKEI 225,也是最弱的股市,当天直接跌了一千点左右,而且还破了下降趋势中继站的支撑。我预计还可以继续跌到达第一道跌幅价位大约 13495。


DAX can consider is the strongest market in Europe, but break the support line finally and getting closer to it final neckline, and what was waiting for is to break the final neckline to confirmed the downtrend.

DAX 是欧洲最强的股市,也终于破了小颈线,离大颈线越来越近,最后等待的是跌破大颈线来给大头部做个确认。


Lastly, the FTSE100 fate is unavoidable to having a big crash, but it the damage is lesser if compare to DAX. Maybe this is due to the FTSE100 is broke the neckline already thus the momentum is decrease. However, GBP/USD is facing the biggest drop in the half century, and I predict it can be reach the second downtrend target price. 

最后,这个事件的主角虽然也一样打劫难逃,但是跟DAX 相比跌幅却来得少。也许,主要的原因是因为起跌点的位置并不是在大颈线之上。然而,GBP/USD 就相反,跌副简直是到达了近这半个世纪的底点,我预计还可以到达第二波段跌幅。


In summary, Now all the major stock market is still at the high-side, especially Dow Jones Index and S&P 500 which is just going down from the top of head-side, DAX just heading near to the neckline; If compare with FTSE100 and Asia stock market which is broke the neckline already. So, We can see from here that all the stock market is heading to downtrend, plus I do not think there is any good news will be announce in the future (except a new round of QE is activated). Even though FED is give up to jack up the interest rate in July, but it doesn't mean the bearish trend is able to twisted. That is why George Soros is return from retirement and started to short the market.

So, BREXIT is just a beginning.


总的来说,现在众多的股市都还处在高档当中,尤其是美国的Dow Jones Index 和 S&P 500 只是刚刚从头顶跌破,而德国的DAX 才刚要接近破颈线;相比之下英国的FTSE100 和亚洲股市都已经跌破了颈线。其实,从这里可以看得见全球的主要市场已经是往下走,而且在未来的日子里并看不见有任何的利多消息;就算FED 在七月里不会升息,也并不代表可以扭转这个空头趋势。基于如此,也难免George Soros 会复出来做空股市。

所以,BREXIT 只是一个开始。 


Sunday, 26 June 2016

PADINI & IVORY Still Continue The Path To Glorious? Sorry, I Don't Think So.


Now PADINI trend has become a weak structure, so far it fall below the small neckline and formed a small head, then 2.2 is become the most important support now. Once broken, the bigger head will become more obvious. Anyway, I do think that PADINI won't break record high and I won't think to buy in at all too. 

PADINI 如今的走势已经变成了弱势结构,目前还跌破了小颈线构成了一个小头部,现在2.2 将会是一个非常重要的支撑,一旦破了,大头部也更加明确了。无论如何,我认为PADINI 不再可能创新高 2.8,而且目前也不会建议买入。


For the same thing, IVORY is also the same type -Weak Structure. No any strong signal appear after 10 trading day that I had mention, some more still break the support. Now, with the market sentiment, I predict it is possible can go to 0.4 and below. So, PADINI & IVORY Still Continue The Path To Glorious? I have to sorry to said "I don't think so".

同样的,IVORY 也是属于同一个类型 - 弱势结构。在10个交易日后完全没有出现翻强讯号,反而还跌破支撑。而如今配合市场情绪,我预计可以看到0.4 以下的IVORYPADINI & IVORY Still Continue The Path To Glorious? 对不起,我必须说我不认为。


Monday, 20 June 2016

After June Still Have July


The recent Brexit campaign tragedy "temporarily" ease tense from global market, and so for KLCI too which showing a strong reversal, but it just return to the shock interval. However, the market sentiment is still exist.

In addition, even though return to shock interval, KLCI is expect to have a confirm signal with or right after the time frame if said going to bullish, otherwise the possibility turn into bearish is increase. In fact, this point should also be a time for the next FED interest rate meeting. Unless FED give up on hiking interest rate, otherwise, after June, still have July.
  

凭着英国的一场悲剧“暂时”让全世界的股市翻转,而KLCI 也跟着出现强势翻转,但也只是回到震荡区间,由危急变成暂缓而已。所以,市场情绪依然是围观。

另外,纵使回到震荡区间,KLCI也必须在时间框内或大概结束之后有所表态,不然由盘转空的几率就大了。其实,这也应对了FED 下一个升息会议的时间点。总的来说,除非FED 放弃升息(紧缩),不然躲得过六月,也躲不过七月。


Thursday, 16 June 2016

The Clue of Big Crash - Gold Spot


Early in the first quarter of 2014 when gold spot fell below the neckline, no more close monitoring after downtrend target price is drew.

早在2013 第一季当黄金跌破颈线,画了跌幅满足够就不再观察了。


Until recently the market (KLCI) and the global stock market crash then started to look back to the trend of gold spot, cause gold is the safe haven for all assets, discover that gold is breakthrough the uptrend support line, and entering a high band shock interval after all. 

Although it broke the second shock interval once before, but it took one trading day to recover and move above the support line, so this is means for the main force, also means big player is deploy since 8/2/2016, thus the starting point is won't broken easily.

Ironically, gold spot strong signal occurred in 3/6/2016, meanwhile KLCI is breakthrough the downtrend resistance line in the same day. Then, the next trading day 6/6/2016 KLCI rose about 12 point, and rose about 11 point at 7/7/2016. However, 8/6/2016 the market is stared to crash, but gold spot is rose about 15 point. Finally, KLCI bearish is confirm at 10/6/2016 which is the fake signal is formed after fall below the support! This is what I means Monday Blue? Black? After that, what happened is the market collapse. Frankly, 7 days closing with a black candle stick continuously and decline almost 50 points,  if this is not a bearish, then what is so-called bearish? Some more KLCI break the support by today.


直到近期大盘(KLCI) 和全球股市崩盘,才翻看回黄金的走势,毕竟黄金是所有资产的避风港,发现黄金在 2月8号时突破了上升趋势支撑线,从此以后就一直在高档盘震 。

虽然曾经一度跌破第二震荡区间的支撑线,但是却用了一天交易日的时间站上支撑线上,这个就是主力的力量,也代表主力从 8/2/2016 开始布局了,必然主力不会轻易让起涨点被跌破。

讽刺的是,黄金的专强讯号是发生在3/6/2016,而当天KLCI 还突破了下降压力线,然后下一个交易日 6/6/2016 大涨大约12 点,然后7/6/2016 涨大约11 点。然而,8/6/2016 就是崩盘的开始也就是黄金出现拉高收盘。最后,在10/6/2016 KLCI 正式跌破支撑而形成假讯号也代表空头确立!而就是我称为的黑色星期五;之后所发生的事情就是我们所见到的崩盘。坦白说,一连7 天收黑还跌了将近50 点,如果这个不是空头,什么才叫做空头?而且今天的KLCI 收盘还直接跌破支撑线。


Gold? Still rose until today! So, I believe the foreign investor is really amazing, pull up KLCI a bit, buy short options, then use the big event - BREXIT - in this month to make the market collapse, then earn from gold & options. So, I am learn from this incident, if wanted to become the top analyst, then is a must to conduct a comprehensive analysis to all the financial market, so that a bigger picture can puzzled in the financial market. 

而黄金呢?就一直连续涨到今天!所以,我相信外资真的好厉害,先拉KLCI 涨一点,部空KLCI期权, 然后利用这个月的题材 - BREXIT - 来杀个片甲不留,大赚黄金和期权。这次的事件让我领悟了一样东西,如果要成为一个顶尖的分析师,就必须要对所有的金融市场进行全面的分析,这样才能够拥有一个全球金融市场的大图像


Tuesday, 14 June 2016

UEMS & MINHO Is Looks Black Too

We must respect the market. The experience of the past three days "disaster" is enough to destroy those rising stock. Especially, UEM SUNRISE-ing turn into dark cloud cover; even like MINHO with corporate activity announcement that can push one more wave up also couldn't escape unharmed.

Now, breakthrough from UEMS become fake signal and I predict will maintain low band sideways, while MINHO retracement to the support but once broken will having the same way as UEMS. Anyway, both forms have been destroyed, Market instability make the stock looks badly. Well, I believe no exception for most of the counter.


必须要尊重市场。经历了过去一连三天的“灾难”,足以让一些初升段趋势的个股,完完全全被摧毁。UEM SUNRISE 明显的从Sunrising马上变成乌云盖顶;就算是夹着一连串企业活动的MINHO,在主力欲再推多一个波段,也难逃一劫。

UEMS 如今的突破变假突破,预计会维持一段低档横盘,而MINHO 却即将回撤
到前波段高点,一旦跌破又会维持跟UEMS 一样的走势。无论如何,双双的形态都已经被破坏,所谓大盘不稳,地动山摇,相信大多数的个股也没有例外。


Timing...

 Today is the first post without any chart... Just because of I realised the important of timing...